
To improve organisational effectiveness, it is essential to determine the optimal “spans of control”. Company culture, work complexity and desired outcomes are key to determining a manager’s ideal number of direct reports. This article reviews best practices, and potential pitfalls, and offers insight into the span analysis.
Reading time: 5 minutes
At Q5, we are often asked, “What spans of control should we have to maximise the effectiveness of our organisation?” Unfortunately, the answer isn’t so simple. That is why, most of the time our response is “it depends.”
Even though best practices and rules of thumb exist, there is no ‘optimal’ number. The spans of control will depend on factors ranging from culture to the complexity of the work.
Your ‘optimal’ number will also depend on your desired outcomes. Many organisations look to improve their effectiveness and efficiency, while others prioritise cost reduction by reducing their manager-to-employee ratio.
In this article, we delve into the effects of different spans of control, highlight potential pitfalls to avoid, and share best practices along with the strategies we employ at Q5.
Spans of control refers to the number of direct reports a manager oversees. A “narrow” or “low” span of control indicates that a manager oversees fewer employees. However, a “wide” or “high” span of control describes a manager overseeing a larger number of employees.
We also use the term “layers”. This is the number of managerial levels between the CEO and the most junior employee in the organisation.
At Q5, we assess spans of control and layers in most organisations we work with. They are an important part of organisation design because they impact the level of hierarchy, autonomy, accountability, communication, and efficiency within teams and the whole organisation. Organisations must weigh up the trade-offs between having wide or narrow spans of control, and match this to their vision.
While both wide and narrow spans of control are acceptable depending on your organisation’s context and ambitions, there are some red flags to avoid.
When we analyse spans of control, we consider the team or function’s size and the nature of its work.
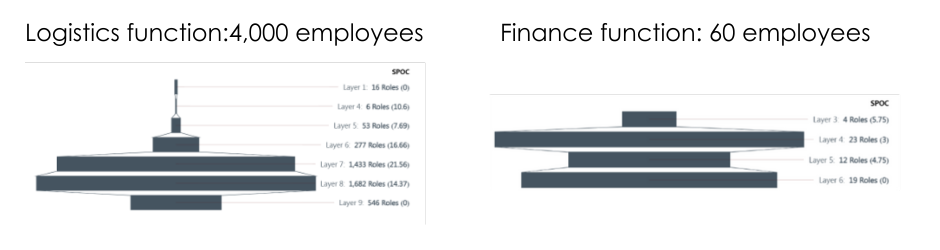
For instance, a logistics function with 4,000 employees can justify seven or eight layers and wide spans of control. Meanwhile, a Finance function in the same organisation, which has 50-100 employees, should not adopt the same principles.
These functions perform different types of work, vary significantly in size, and likely have different requirements from their people managers. It is why we analyse them separately to determine the optimal span of control.
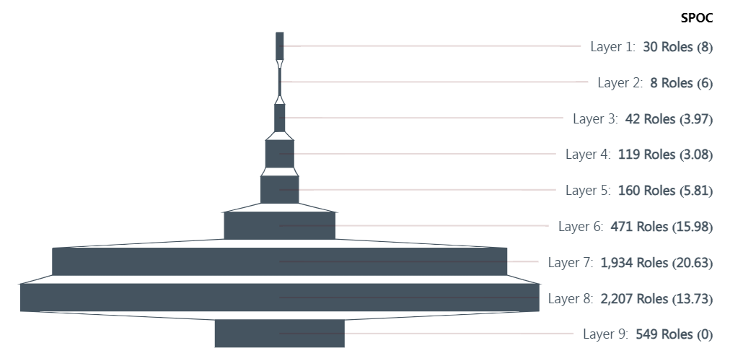
An example spans and layers analysis based on a holistic view of the whole organisation may look like this…
Whereas, if you split the two functions out separately, they would look like this…
Unfortunately, there isn’t a ‘one-size-fits-all’ answer to identify the right spans of control. However, there are some general principles to follow at an organisational level:
Nevertheless, there are exceptions to these principles. Company culture, current managerial capability and desired ways of working affect your optimal span of control.
For example, to facilitate faster decision-making and empower employees, we would recommend a wider span of control.
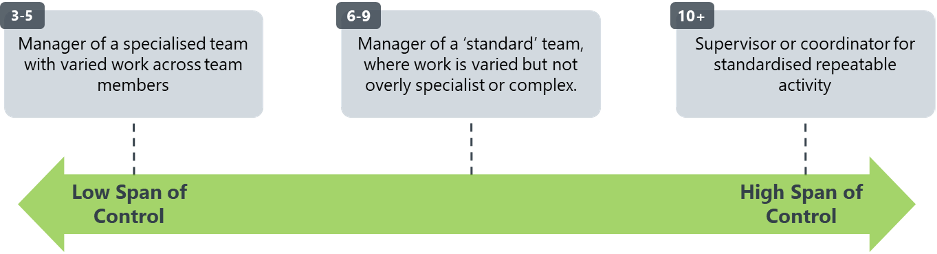
Whereas, at a team level, it is important to consider:
The spans of control highlighted in the diagram below serve as general guidelines for three common manager archetypes, based on the type of work being performed by their team.
Nevertheless, no matter whether you are assessing your whole organisation, a function or a specific team, you must consider what your priorities are. Organisations focused on cost reduction often have unrealised savings by having excess managers and spans of control that are too narrow.
As an example, we often see organisations with >9 layers and average spans of control of <4. In such cases, there are clear opportunities to increase spans of control and reassess the amount of people managers there are in the organisation, which can reveal potential cost savings.
At Q5, we support our clients use their data to inform their organisation design, working alongside our award-winning “Metro Map” methodology.
Our proprietary tool, OrgMaps, quickly transforms HR data into organisational insights, including spans of control and layers, which can be cut by team, function, or geography to provide a comprehensive understanding of every aspect of your business.
Click here to find out more about what OrgMaps can do.
Or book an OrgMaps demo here.


 by
by